File:Global Temperature And Forces With Fahrenheit.svg

Original file (SVG file, nominally 1,200 × 675 pixels, file size: 13 KB)
Summary
| Description |
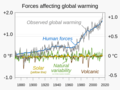
Català: Canvis en la temperatura de la superfície global del 1880 al 2025 (línia negra) en relació amb la mitjana del període 1850–1900.
English: Changes in global surface temperature from 1880 to 2023 (black line) relative to 1850–1900 average.
|
| Date | |
| Source | Own work based on SPM.1b in https://www.ipcc.ch/report/ar6/wg1/figures/summary-for-policymakers (archive) |
| Author | Efbrazil |
| Other versions |
File:Global Temperature And Forces With Fahrenheit.svg contains 2 translations.
|


| This SVG file contains embedded text that can be translated into your language, using any capable SVG editor, text editor or the SVG Translate tool. For more information see: About translating SVG files. |
This file is translated using SVG <switch> elements. All translations are stored in the same file! Learn more.
For most Wikipedia projects, you can embed the file normally (without a To translate the text into your language, you can use the SVG Translate tool. Alternatively, you can download the file to your computer, add your translations using whatever software you're familiar with, and re-upload it with the same name. You will find help in Graphics Lab if you're not sure how to do this. |
Related file
-
 Global Temperature And Forces.svg
(Precursor graphic, without Fahrenheit scale) -
 20231114 Attribution of global warming to climate drivers- based on NCA5 Fig. 3.1.c.svg (similar concept from the US National Climate Assessment)
 -
 20231114 Attribution of global warming to climate drivers- NCA5 Fig. 3.1.c.jpg —
NCA5 original -
 20231114 Attribution of global warming to climate drivers- based on NCA5 Fig. 3.1.c.gif
GIF with frames derived from SVG -
 2017 Global warming attribution - based on NCA4 Fig 3.3 - single-panel version.png
 -
 2017 Global warming attribution - based on NCA4 Fig 3.3.png
Two-panel PNG version (Oct 2019)


Licensing
- You are free:
- to share – to copy, distribute and transmit the work
- to remix – to adapt the work
- Under the following conditions:
- attribution – You must give appropriate credit, provide a link to the license, and indicate if changes were made. You may do so in any reasonable manner, but not in any way that suggests the licensor endorses you or your use.
- share alike – If you remix, transform, or build upon the material, you must distribute your contributions under the same or compatible license as the original.
File history
Click on a date/time to view the file as it appeared at that time.
| Date/Time | Thumbnail | Dimensions | User | Comment | |
|---|---|---|---|---|---|
| current | 16:37, 18 April 2026 | No thumbnail | 1,200 × 675 (13 KB) | commonswiki>Hakimi97 | File uploaded using svgtranslate tool (https://svgtranslate.toolforge.org/). Added translation for ms. |
File usage
The following file is a duplicate of this file (more details):
- File:Global Temperature And Forces With Fahrenheit.svg from Wikimedia Commons
The following 3 pages use this file: