File:1850- 09 September each year - Global average temperature changes.svg
Original file (SVG file, nominally 1,200 × 675 pixels, file size: 8 KB)
Summary
| Description |
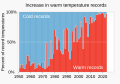
English: Chart showing changes in global average surface temperature annually during the month of September
User:RCraig09/Monthly temperature charts: ● Source for 1850- raw data: Global Land and Ocean Temperature Anomalies. National Centers for Environmental Information (NCEI) of the National Oceanic and Atmospheric Administration (NOAA). Archived from the original on 26 March 2026.
Month-after-month animation:
Seasonality (arrange data longitudinally by month):
|
||
| Date | |||
| Source | Own work | ||
| Author | RCraig09 |


Related files
User:RCraig09/Charts of record temperatures
-
 01 January - Percent of global area at temperature records - Global warming - NOAA.svg
(January data) -
 02 February - Percent of global area at temperature records - Global warming - NOAA.svg
(February data) -
 03 March - Percent of global area at temperature records - Global warming - NOAA.svg
(March data) -
 04 April - Percent of global area at temperature records - Global warming - NOAA.svg
(April data) -
 05 May - Percent of global area at temperature records - Global warming - NOAA.svg
(May data) -
 06 June - Percent of global area at temperature records - Global warming - NOAA.svg
(June data)


-
 07 July - Percent of global area at temperature records - Global warming - NOAA.svg
(July data) -
 08 August - Percent of global area at temperature records - Global warming - NOAA.svg
(August data) -
 09 September - Percent of global area at temperature records - Global warming - NOAA.svg
(September data) -
 10 October - Percent of global area at temperature records - Global warming - NOAA.svg
(October data) -
 11 November - Percent of global area at temperature records - Global warming - NOAA.svg
(November data) -
 12 December - Percent of global area at temperature records - Global warming - NOAA.svg
(December data)


-
 1951+ Percent of global area at temperature records - Seasonal comparison - NOAA.svg
Seasonal comparison -
 1951 - Percent of global area at temperature records (monthly) - Global warming - NOAA.svg
All months scatterplot/dot plot -
 1951- RATIO of new record warm temperatures to new record cold temperatures (monthly) - Global warming.svg
Ratios scatterplot/dot plot (monthly) -
 1951- Percent of record temperatures that are cold or warm records.svg
 -
 1951- Warm and cold record temperatures - bar chart.svg

_-_Global_warming_-_NOAA.svg)
_-_Global_warming.svg)


Licensing
- You are free:
- to share – to copy, distribute and transmit the work
- to remix – to adapt the work
- Under the following conditions:
- attribution – You must give appropriate credit, provide a link to the license, and indicate if changes were made. You may do so in any reasonable manner, but not in any way that suggests the licensor endorses you or your use.
- share alike – If you remix, transform, or build upon the material, you must distribute your contributions under the same or compatible license as the original.
File history
Click on a date/time to view the file as it appeared at that time.
| Date/Time | Thumbnail | Dimensions | User | Comment | |
|---|---|---|---|---|---|
| current | 17:28, 26 March 2026 | No thumbnail | 1,200 × 675 (8 KB) | commonswiki>RCraig09 | Version 4: updating with longer-duration dataset for September |
File usage
The following file is a duplicate of this file (more details):
- File:1850- 09 September each year - Global average temperature changes.svg from Wikimedia Commons
The following page uses this file: